 Continued from: Google Analytics Multi-Channel Funnel and Attribution Modeling Reports Google Analytics is a powerful tool, and by now, you may be wondering how to understand all of these reports and extract data that is useful and relevant to your business. To help you get started, here are 10 easy tips and tricks you can use to master Google Analytics.
1. Never Lose Focus of What You Are Measuring and Why
The most common mistake made with Google Analytics is getting excited about the reports that may be fun to review but are meaningless where it relates to your business. Everyone makes this mistake. In fact, most people only view "vanity metrics" that focus solely on the number of visits to their website.  The key is to understanding Google Analytics reports is to focus on 5-10 KPIs that are important in achieving your website or business objectives. Forget about everything else (or at least spend a minimum amount of time in reviewing this irrelevant data); make time to review the reports that are of paramount importance.
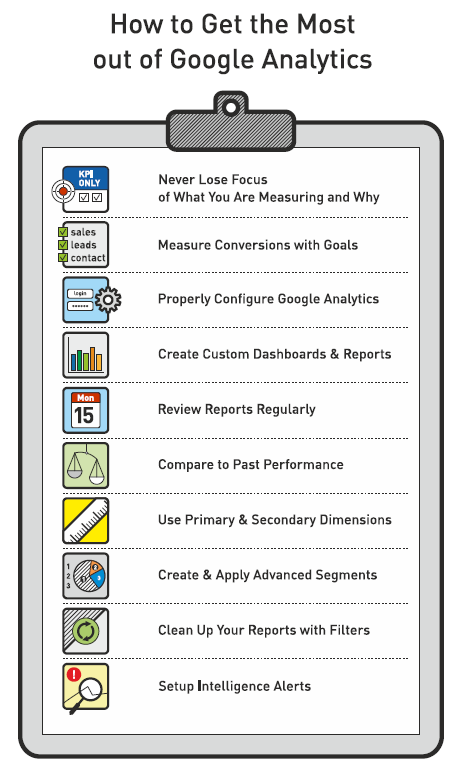
2. Measure Conversions with Goals
To master Google Analytics, you need to define and set goals. Just as your website needs to have SMART business objectives, your Google Analytics account should be configured to measure conversions using goals. Conversions will confirm that you are on track to reach your business objectives. Your conversion rate is the most important KPI, regardless of the objective and the purpose of your website. If you have more than one goal, you should also assign arbitrary monetary value to each goal, even if the value doesn’t relate to a transaction’s purchase value. This allows the measurement of the overall performance in regard to goals that have a bigger impact and get you closer to your business objectives.  For more information on goals, and their set-up and configuration, please refer to How to Set Up Google Analytics Goals and Conversion Tracking, How to Use Google Analytics: Best Metrics & Reports and Google Analytics Conversion Analysis – Setting Goals.
3. Properly Configure Google Analytics
After getting started with Google Analytics, you need to make sure that your account is set up to measure the most important aspects of your business. This is not only necessary to ensure the accuracy of your data, but also to access many additional instruments to better analyze your traffic. This Google Analytics setup checklist will help ensure your Google Analytics is set up properly:
4. Create Custom Dashboards & Reports
Google Analytics allows you to create custom dashboards so you can quickly access the most valuable data. You should spend time creating a dashboard or two that focus exclusively on the KPIs that are pertinent to your business goals. Even though you can create up to 20 dashboards, I would recommend strict focus on only what's important—the 5-10 metrics you identified. Google Analytics also offers a Solutions Gallery of ready-to-use dashboard templates that have been submitted by other users. Some of these dashboard templates are very effective. Google Analytics also allows you to create custom reports, which is a great way to create a report specifically designed for your needs. 
5. Review Reports Regularly
No matter how well you design your custom reports, they are useless if you don't review them regularly. Review your main KPIs weekly and conduct a thorough review of your reports at least once a month. Also, review the performance of your website immediately following any major updates to check that the performance is not affected negatively or that it has been improved. 
6. Compare to Past Performance
Google Analytics reports display results from the past 30 days by default, but you can select any date range you like. You can also use the "Compare To" checkbox, which allows you to compare your current results to any date range in the past. When reviewing reports, you always want to compare them to historic data. Specifically, you want to see positive changes over time in areas that matter. KPIs won't reveal much without comparing your current results to historic values. It is especially important to do this comparison when implementing improvements. After all, the only way to measure what works and what doesn't is by comparing results before and after any modifications. 

7. Use Primary and Secondary Dimensions
Most Google Analytics reports allow change to the primary dimensions of the report. This allows you to further drill down to get more detailed information. In some cases, additional dimensions give you access to a lot more information. Some reports also allow the application of secondary dimensions to provide more information in the same table. Adding Source as the secondary dimension allows a visual of the Source from the traffic’s origin. Applying secondary dimensions allows you to customize your reports to the point where you can cross-reference your data with different data points. In addition, you can save shortcuts to any customized reports. Once on the report, you can click on "Shortcut" to add a link to the current configuration of this report on your Home tab. All report customizations, including advanced segments, secondary dimensions, sorting, etc. will be automatically applied when you access the report with this shortcut. 
8. Create & Apply Advanced Segments
Segments allow you to review traffic based on specific criteria and compare the performance of that "segment" to the performance of the entire website. Segments can be applied to any reports throughout Google Analytics. You can create segments based on dimensions or metrics, visit date, etc. This powerful tool allows you to create reports within reports. Here are some examples of segmenting uses:
- Classify visitors and viewing reports on users who converted (purchased something, expressed interest, etc.) to study their behaviors on the website more closely. You can even create "classes" for users based on the revenue they generate.
- Identify high-value customers (HVCs) by using the Recency-Frequency-Monetary Value (RFM) segment. For example, customers who purchased recently, visited frequently or engaged in most conversions, are more likely to purchase again.
- Focus on new visitors who arrived on the website during a specific time frame of a given campaign to measure the performance of your marketing campaigns.
As you can see, Segment reports are an extremely powerful tool that allow you to analyze reports with real business applications. If you need even more advanced reports, you should ask your web developer to help with the setup. 
9. Clean Up Your Reports with Filters
As part of the project, you and your web developer frequently visit your website. You can configure Google Analytics to exclude the traffic from your office IPs, your web developer's IPs and even your home IPs to ensure that only the real and clean traffic gets recorded. These settings are in Analytics administration. If you have other sections or systems of your website reserved for internal use (corporate extranet, CMS, etc.) be sure that Google Analytics’ code is not present on those pages, unless you also want to track traffic to them. 
10. Set up Intelligence Alerts
Set up custom alerts as well as signing up for default alerts. While you shouldn't rely on Analytics Intelligence as a replacement for regular review of your reports, it can assist you by identifying any issues or opportunities. This tool also uncovers issues you may have missed. The best way to monitor and measure your website’s performance is by regular review of your KPI-based reports backed by automatic Intelligence alerts from Google Analytics. 