 Continued from: Google Analytics Acquisition and Channel Reports Your website user's behavior is the path to conversion. Once you set up Google Analytics on your website, you'll be able to understand precisely how visitors interact with your site. The following Behavior reports in Google Analytics are designed to help you improve your visitors' experiences, meet their needs and guide them toward conversion.
Behavior Overview
The Behavior Overview report focuses on individual pages of your website, as opposed to the entire site. It gives you an overview of pageviews, unique pageviews, average time spent on each page, bounce rate and exit rate. You can also review how the content is performing by page URLs, titles, search terms or events.

Behavior Flow
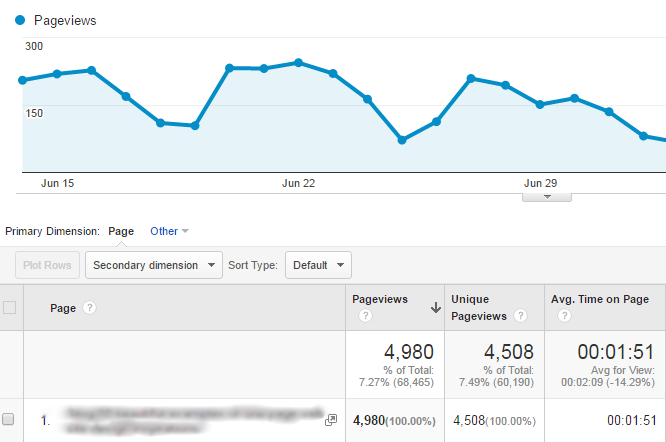
Similar to other flow reports that Google Analytics offers, the Behavior Flow report lets you visualize the path visitors traveled from one page to the next. This report allows you to discover what content is most engaging. It shows how people arrive at the website (landing page) and where they go from there (interactions) as well as exit (drop-off) points. Note that the Behavior Flow report can also be used to visualize pages and events (video plays, for example).
Site Content
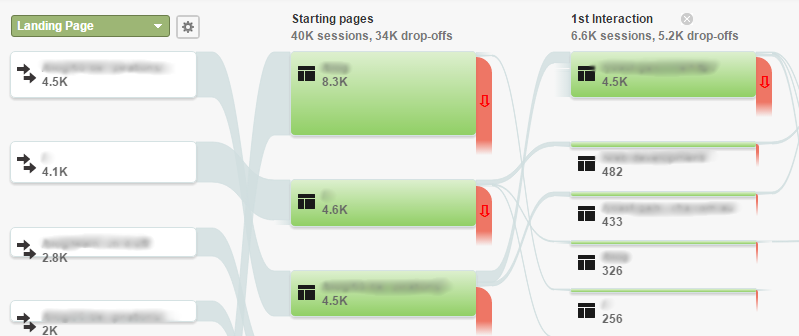
The Behavior Analysis Site Content reports focus on just that – your website content. They show what content is more engaging and effective. Based on this information, you can understand how well your content really addresses your website's objectives:
- All Pages – This report shows the effectiveness of individual pages with a breakdown by pageviews (number of times that a page was loaded), unique pageviews (from first-time visitors), average time spent per page, number of entrances per that page, the page's bounce rate and exit percentage (how often people exit the website from that page), as well as page value (transaction revenue + total goal value)/unique pageviews.
- Content Drilldown – This report is similar to All Pages, but instead of showing a list of all pages on the entire site, it groups them by parent sections. In other words, you can see structurally, which top sections of the website are more important (i.e., Products, Services, About Us) and then drill down to individual pages within these sections.
- Landing Pages – Landing Pages are the first-entry pages that visitors access when they arrive on your website. In addition to displaying the same metrics as the other Site Content reports, this report focuses on the Acquisition-Behavior-Conversion model and includes conversion data that shows the effectiveness of these entry points relating to conversion.
In many cases, your most active landing page is not your website homepage. Users often enter your website through search engine results, and at times individual pages can outperform the homepage (for example, if you are conducting content marketing and have an effective article or a popular promotion).
If your landing pages have a high bounce rate, or visitors spend only a few seconds on these pages, it is most likely an indicator that these pages do not meet visitors’ expectations, or that they are not effective in engaging and retaining your visitors' attention.
- Exit Pages – Similar to Landing pages, exit pages are the last pages that visitors see when exiting your website. This report will tell you which pages are the main drop-off points for your website. If they also happen to be your most important landing pages, perhaps they are ineffective in engaging visitors. On the other hand, if many visitors leave your website from pages that conclude transactions (like a "thank you" page following a purchase or an information request), that is an indicator your website is working as intended.
Site Speed
Your website's speed plays a critical role in the website's ability to convert. Today's website visitors are impatient, and if your website is slow, they will move on. According to Kissmetrics, research shows that your website can lose traffic at the average rate of 7% per second of wait time while your page loads. The loss percentage for users on mobile devices is even higher. Google announced that website speed has an impact on search ranking in the search giant's results. The faster your website is, the better positions you will achieve in search results. Website speed optimization is extremely technical, so you should ask your web developer to review reports for improvement. The following reports will help you and your web developer optimize your website for speed:
- Overview – The overview shows your page load times broken down by components and across different dimensions (i.e., in different browsers and in different countries). These numbers will reveal what components of your website are slower and how the demographic is affected.
- Page Timings – This report provides a breakdown of the pages that are the slowest to load, so your web developer can optimize them for better performance.
- Speed Suggestions – This report provides speed recommendations for the pages that load slowly. This report should be studied by your web developer.
- User Timings – This report allows the website owner to measure timing of specific events or user interactions. This report requires additional set-up that must be completed by your web developer.
Site Search
Today's customers want to find what they are looking for quickly and effortlessly, and failing to provide the specific information they seek will result in lost visitors and conversions. If your website has a search box, analyze the entries to learn the commonalities among the searched keywords. This gives excellent insight into the needs of prospective customers. Google Analytics needs to be configured prior to tracking search queries. Ask your web developer to help you with this step, and then take a closer look at the following reports:
- Overview – The Behavior Analysis Search Overview tells how many of your visitors search your site, the search terms your visitors use and how your visitors subsequently engage with your site.
- Usage – This report gives the Acquisition-Behavior-Conversion breakdown between visits that included an internal site search and those that did not. This gives you a great overview of the search feature’s effectiveness.
- Search Terms – This report gives the breakdown of the popular search terms your visitors use, as well as other parameters, such as the number of times they viewed search results, exits from your site following search, time spent on the site resulting from search, etc. Reviewing this data will show you the specifics of your visitors’ expectations of your website. The fact that they search for it means they have an interest, but it also tells you that they were not able to find it on their own. This can potentially mean there is room for improvement in website navigation and usability.
- Pages – Similar to search terms, this report shows the breakdown of specific pages that visitors searched on your website. This data may reveal deficiencies where website users weren’t able to find what they wanted on a particular page and resorted to using the search tool.
Events
Events are user interactions with your website that don't require loading a page, for example, playing a video, printing a page, downloading a file, liking a page on Facebook, etc. Since most data in Google Analytics comes from page loads (i.e., when a link is clicked and the user is taken to another page on your website), setting up events allows you to track actions within these pages. Events can be a valuable tool that measures the user’s behavior as it leads to a conversion. For example, let's say that you have a video embedded in your site's homepage. You want the visitors to watch the video that is designed to engage them and, coupled with calls to action, drive them to conversion. How can you measure interactions of your users with this video? This can be achieved by making use of events. Setting up events requires additional technical set-up that should be completed by your web developer. First, you should decide which events you want to track. You can set up multiple events in different categories (video, for example), as well as various actions, e.g., Play, Pause or Label (any additional information, such as the title of the video). The more granular information you provide, the easier it will be to track. For example, you can track Plays of the Video with the label Main, or better yet, see how many of these Plays lead to a conversion.
- Overview – The Overview report lets you see the big picture of events throughout your website, including the breakdown by category, action and label. Similar to goals, you can assign arbitrary event values to measure their importance or impact. For example, a video play can be a value of one, and if the user viewed the entire video, it would rank a ten.
- Top Events – This report shows you the ranking of events by the number of occurrences, total event value, average value, etc.
- Pages – This report gives a breakdown of pages where events took place with the number of occurrences, total event value, average value, etc.
- Events Flow – The Events Flow report lets you visualize the steps visitors took prior to an event.
AdSense
If you serve ads on your website using Google AdSense, these reports will help you review the performance of the ads that you serve (e.g., eCPM, Unit Impressions). This requires linking your AdSense account to your Analytics account (consult your web developer for help with that). 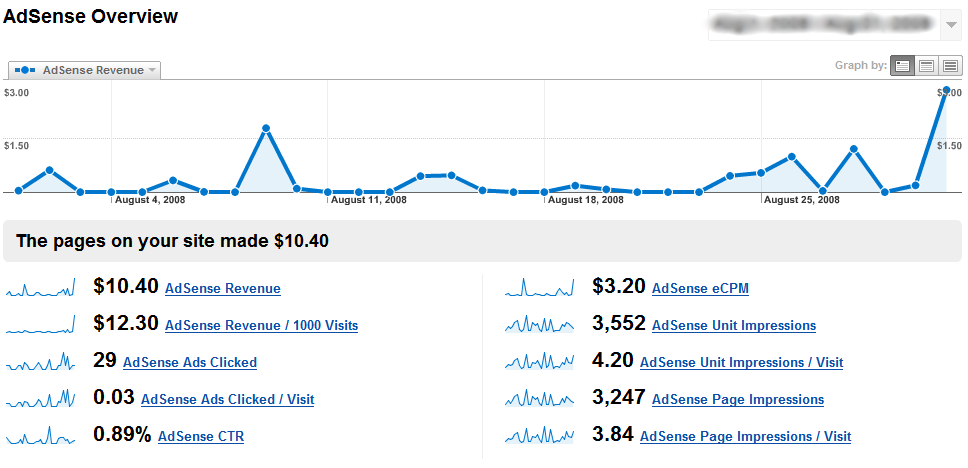

Experiments
Experiments are primarily conducted to improve goal conversion and allow testing to determine what page design is most effective in converting your visitors. Google Analytics has a built-in tool for setting up and running experiments on your website. A web page variation is selected and tested for performance. Google Analytics is able to test up to five variations of a page and run up to twelve experiments concurrently. 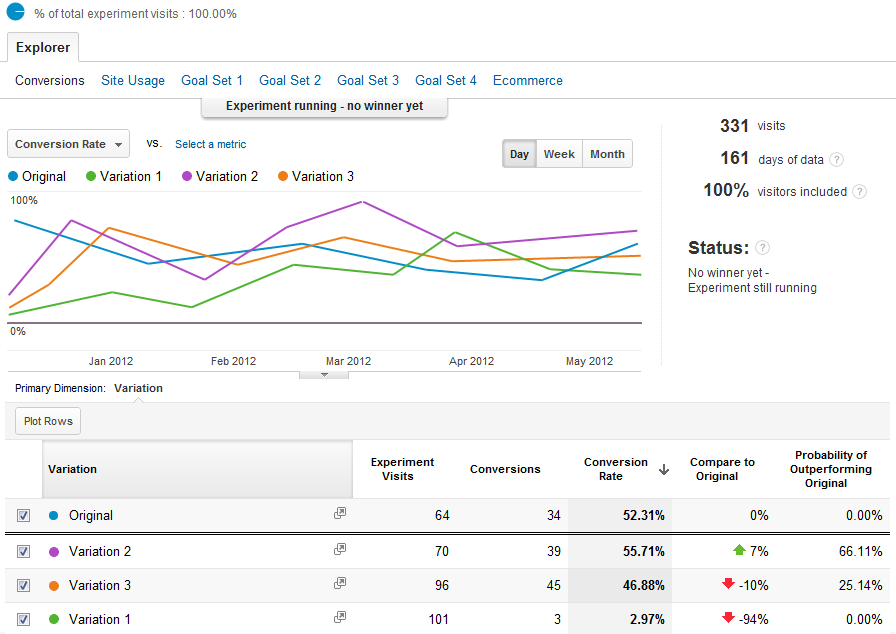
In-Page Analytics
In-Page Analytics allows you to make a visual assessment of visitors’ interactions with your website. The data is displayed as visually overlaying your website. This tool allows you to assess the following: did the visitors focus on the content you wanted them to see, did they get positive results from their search and did they click on the calls to action that you wanted. Google Analytics has a lot of information to offer:
- Control Bar – When you open this report, Analytics displays your website with various metrics visually overlaid on your website. The control bar across the top of the report lets you select the metrics to show and hide the color scale for bubbles and to turn the browser-size visualization on and off.
- Show Bubbles – The Bubbles indicate the links website visitors clicked. The numbers inside bubbles represent the metric you chose in the control bar (clicks on these links, for example).
- Show Color – The Color feature applies different colors to bubbles of different values, which are similar to heat maps.
- Browser Size – This neat feature lets you see the portion of your website that is visible to the selected percentage of users without scrolling. For example, if you selected 80% in the control bar, the Analytics will show you the portion of the webpage that at least 80% of users can see without vertical or horizontal scrolling.
Interested in learning more about Google Analytics? Check out our other articles:
