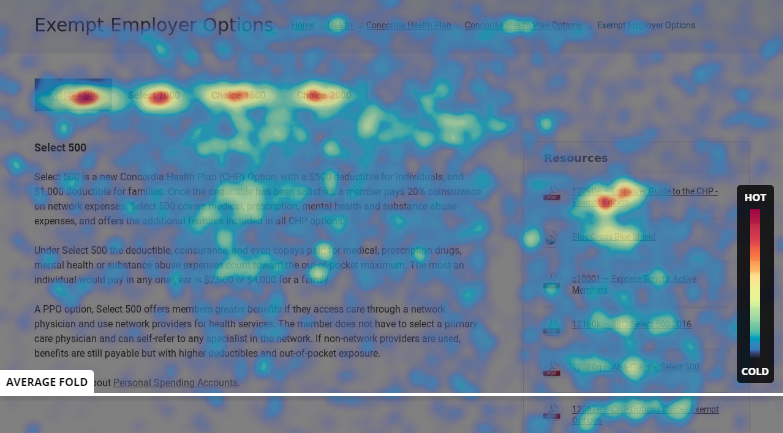
 Continued from: 'The Best 5 Tools for Website Usability Testing' To optimize your website for conversions, you need to know where people click and what they select on a page. Are your users not clicking on the calls-to-action? Are you wasting prime real estate on “stuff” that no one cares about? What percentage of users clicked the primary button versus a smaller link below it? What can you do to improve your conversion rate? You can learn the answers to a lot of these questions by viewing the visual representation of clicks overlaid on your website. This can show you quickly whether calls-to-action are working the way you expected, or if users are wandering off elsewhere. A heatmap is a visual representation of clicks that resembles thermal imaging. The hot (red) zones are the areas that get the most clicks, yellow represent fewer clicks, green hardly sees any activity and blue see no action at all. It’s not just about what is clicked, but also who clicks it. Heatmap analysis is particularly helpful when combined with user experience analysis and behavior insights. Here's a heatmap looks like:
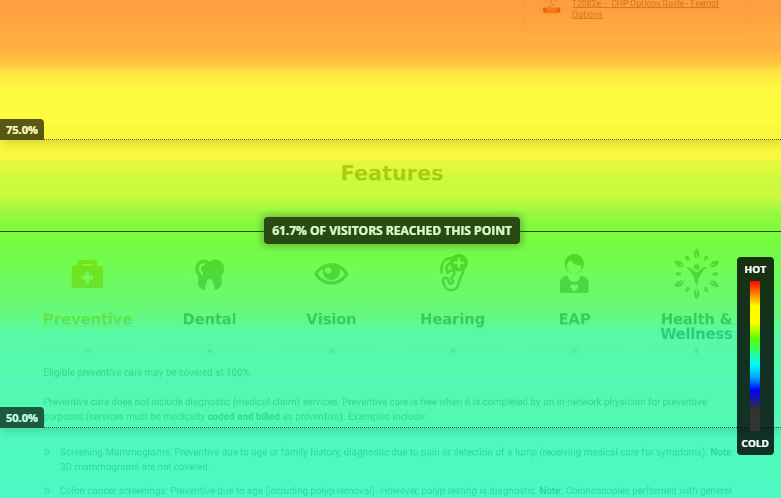
  Scrollmaps, like heatmaps, show you how far down the page the user scrolls and where attention fades or disappears. If you have important information below the fold of the page (the point on the page that requires scrolling), most users may not even get to it. The scrollmap will show you exactly how far most people go. Here's an example of a scrollmap:
  Here are the best heatmap and scrollmap tools to help you analyze your website visitors' behavior.
- Crazy Egg Crazy Egg is one of the most popular solutions to generate heatmaps and scrollmaps with overlays (seeing numbers or percentages of clicks) and confetti (distribution of traffic—based on source or destination) for your website.
- ClickTale ClickTale is another tool designed to visualize and measure website behaviors. The tool allows visitor mouse-movement recordings and mouse-move heatmaps (strongly correlated to eye movements), as well as traditional click heatmaps.
- Hotjar Hotjar provides a host of features, including heatmaps, scrollmaps, real visitor recordings, conversion funnel tracking and form analysis, that allow you to see how your visitors are actually behaving on your website.
- Kissmetrics Kissmetrics provides a complete picture of user’s focus and navigation on your website and where the revenue is generated. As their website states, "Google Analytics tells you what happened, and Kissmetrics tells you who did it." The service claims to fill this gap by illustrating every action of each user and every step they take.
- Woopra Woopra is an alternative to Kissmetrics, this tool is easy to use and comes with several nice features to decipher and analyze the behavioral patterns and engagement of visitors on your website. Features include retention analytics, funnel analytics and segmented analysis.
Next: 'Best Tools for A/B and Multivariate Testing'


